
Mastering Marketing Performance Metrics
Why Marketing Metrics Are Your Business Compass

Trying to grow a business without solid marketing data is like trying to navigate a ship in a thick fog. You feel like you're moving, but you've got no idea if you're heading for treasure island or straight into the rocks.
This is where marketing performance metrics come in. They are the instruments that clear the fog, acting as an indispensable compass for your business.
These numbers give you the hard feedback you need to guide every single strategic decision. Whether you're setting the annual budget or tweaking a live campaign, metrics turn guesswork into calculated, informed action. They show you, in black and white, what’s working, what’s a waste of money, and where your next big opportunity is hiding.
Without them, you're just running on gut feeling. That's a huge gamble when real investment is on the line.
The Difference Between Metrics and KPIs
It’s crucial to get the distinction between a simple metric and a Key Performance Indicator (KPI) straight. While every KPI is a metric, not every metric is important enough to be a KPI.
Think of it like this: a metric is any single piece of data you can track, like website page views or the number of followers you have on Instagram. They're useful, but they don't always tell the whole story.
A KPI, on the other hand, is a metric you've specifically chosen because it’s tied directly to a critical business goal. It’s one of the handful of numbers that truly shows if you're on track to succeed. For example, 'page views' is a decent metric, but ' conversion rate ' is a far more powerful KPI if your main goal is to generate sales.
A metric tells you what happened. A KPI tells you if what happened actually mattered to your business goals. Focussing on the right KPIs is what separates high impact marketing from just being busy.
Moving Beyond Vanity Metrics
One of the easiest traps to fall into is chasing ‘vanity metrics’. These are the numbers that look impressive on a report but have very little to do with actual business performance. A sudden spike in social media likes feels great, but it’s essentially meaningless if it doesn’t lead to more enquiries, sales, or happier customers.
To really prove your marketing’s worth, you have to connect your activities to real world results. This means building a framework that ties every campaign back to core business objectives. For a deeper dive into creating a strategy that works, our ultimate guide to digital marketing is the perfect place to start.
The end goal is simple: create a clear, unbroken line from the money you spend to the revenue you generate. When you focus on the marketing performance metrics that demonstrate genuine growth, you can report on your impact with confidence and make a rock solid case for the resources you need to win.
Choosing Metrics That Actually Matter to Your Business
Picking the right marketing metrics is like choosing the right tools. You wouldn’t use a sledgehammer to hang a picture frame, would you? In the same way, the metrics you obsess over must be directly tied to what you’re trying to achieve as a business. Otherwise, you’re just measuring noise, not progress.
Let’s be honest, not all metrics are created equal. The ones that truly count tell a clear story about how your marketing is hitting the bottom line. Whether your big goal is to get your brand name out there, pull in a steady flow of leads, or build an army of loyal customers, there’s a specific set of numbers that will show you the real score.
Matching Metrics to Your Objectives
The secret is to connect your measurement strategy directly to your business goals. A startup hustling for its first 1,000 users is going to be watching completely different numbers than an established brand focussed on making their existing customers spend more over time. You’ve got to be crystal clear on what you want to achieve before you decide how you’re going to measure it.
So, what’s your priority right now?
- Want to Increase Brand Awareness? Keep your eyes on things like social media reach, website traffic, and your brand's share of voice online.
- Need to Generate More Leads? The metrics that matter are landing page conversion rates, cost per lead (CPL), and the number of marketing qualified leads (MQLs) you're handing over to sales.
- Trying to Improve Customer Loyalty? You should be tracking customer lifetime value (CLV), churn rate (how many customers you're losing), and how often people come back to buy again.
This visual breaks down some of the most fundamental metrics that almost every business should be thinking about.
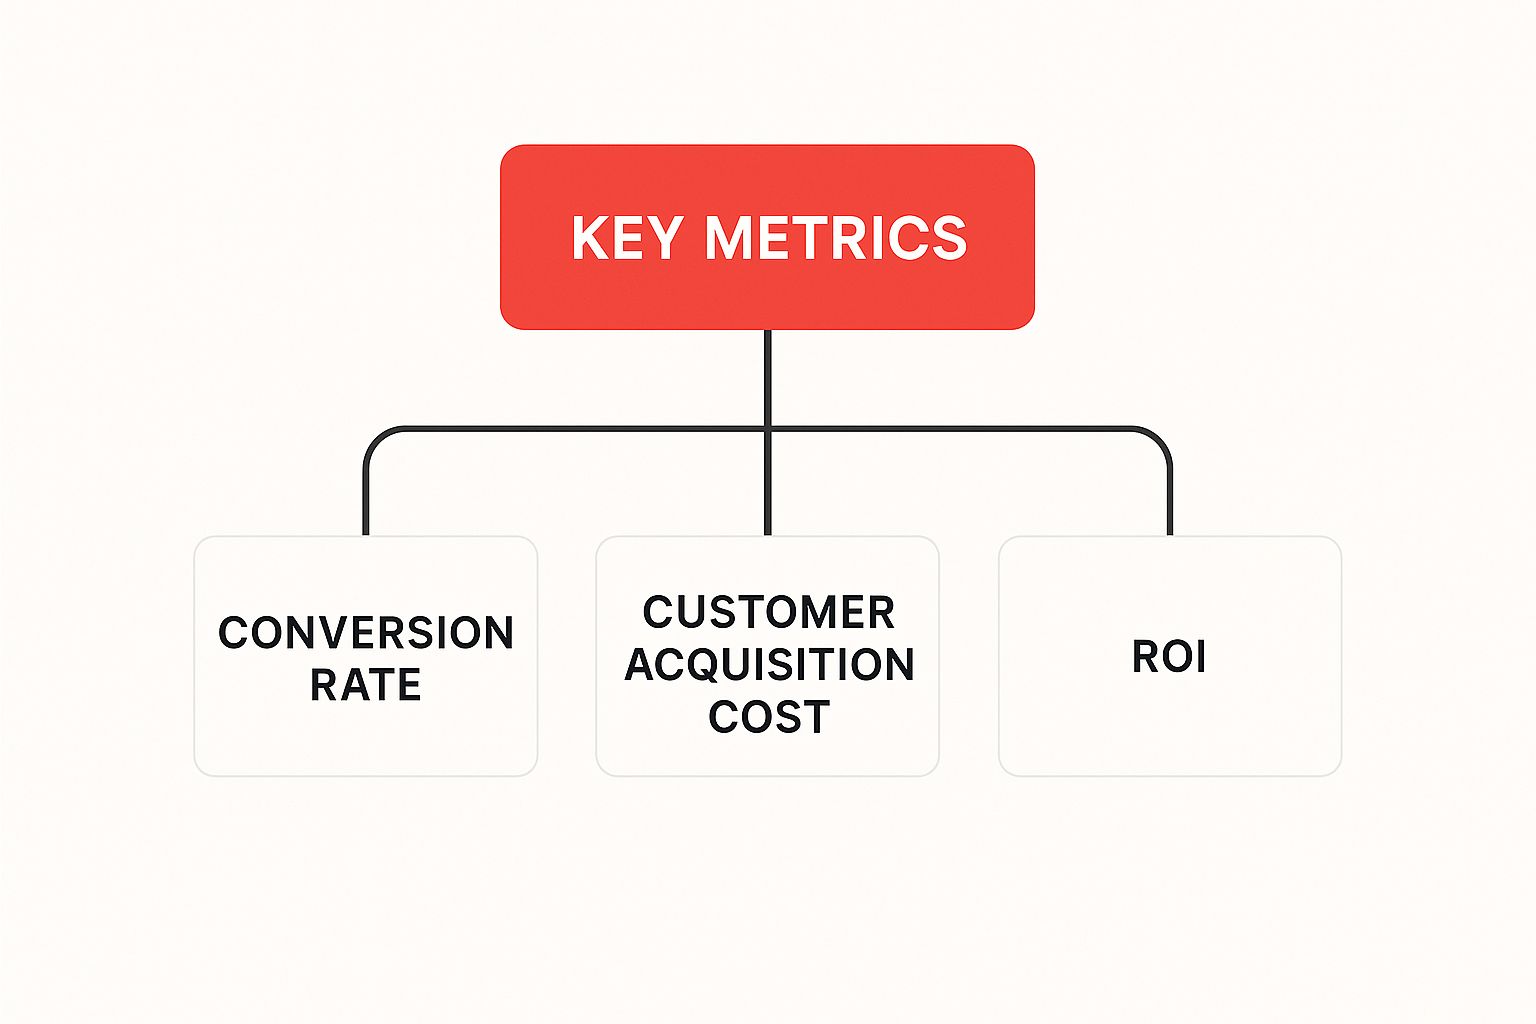
It’s clear that things like Conversion Rate, Customer Acquisition Cost, and ROI are the bedrock. They’re the core pillars that support everything else, giving you a solid read on your overall marketing performance.
A Simple Framework for Your Metrics
To make sure you're tracking what really moves the needle, you need a simple framework. Don't just gather data because you can. Start with your end goal and work backwards. What numbers will light up the path to get you there?
This approach gives every single number on your dashboard a real purpose. It stops your team from chasing vanity metrics and keeps everyone focussed on the stuff that drives genuine results for the business.
Interestingly, a recent survey of UK businesses shows that not everyone is focussed on pure profit. Despite being generally happy with their marketing, only 7% of professionals said ROI was their most important metric. What came out on top? Sales ( 22% ), social media engagement ( 20% ), and website traffic ( 18% ). This tells us that for many, engagement and lead generation are the immediate priorities. You can dig into more of these UK digital marketing statistics to see how your own focus compares.
The best marketing teams don’t track everything. They pick a handful of critical KPIs that directly reflect their most important business goals. That’s how you turn a sea of data into a clear roadmap for growth.
To bring this to life, let’s look at how specific objectives translate into concrete metrics.
Matching Metrics to Marketing Objectives
| Marketing Objective | Primary Metrics | Example Application |
|---|---|---|
| Build Brand Awareness | Website Traffic, Social Media Reach, Impressions, Share of Voice | A new software company launching a product would track mentions across social platforms and an increase in direct website visitors to see if their launch campaign is cutting through the noise. |
| Generate High-Quality Leads | Conversion Rate, Cost Per Lead (CPL), Marketing Qualified Leads (MQLs) | A B2B service provider would focus on the conversion rate of their "Request a Demo" landing page and how many of those leads are a good fit for the sales team. |
| Drive Sales & Revenue | Customer Acquisition Cost (CAC), Return on Ad Spend (ROAS), Sales Revenue | An e-commerce store running Google Ads would measure ROAS to ensure every pound spent on advertising is bringing in more than a pound in sales. |
| Improve Customer Loyalty | Customer Lifetime Value (CLV), Churn Rate, Repeat Purchase Rate | A subscription box service would obsess over its monthly churn rate, aiming to keep it as low as possible to prove the long term value of its business model. |
| Enhance Customer Engagement | Email Open/Click-Through Rates, Social Media Engagement Rate, Time on Page | A content heavy blog would monitor how long people are spending on their articles and the engagement rate on their social posts to see if their content is truly resonating. |
This table isn't exhaustive, but it shows how different goals demand different scorecards. The key is to pick the right one for the game you’re playing.
Time for a Metrics Audit
Take a hard look at your current marketing dashboard. For every metric you see, ask yourself one simple question: "How does this number help us make better decisions to hit our main business goal?"
If you can't answer that question instantly and with confidence, it might be time to demote that metric from your reports.
This quick audit can be a real eye opener. It often shows we’re leaning on metrics that make us feel good but don't actually offer any strategic value. A huge number of impressions might look great in a report, but if it doesn't lead to clicks, leads, or sales, it’s not really helping you grow.
By ruthlessly culling the metrics that don't matter, you simplify your reporting and focus your team's energy where it counts. This kind of clarity is what separates a data driven marketing team that proves its value from one that just stays busy.
Essential Metrics for Key Marketing Channels

Effective marketing isn’t a single lane road. It’s a complex network of different channels all working together, and each one—from social media to paid ads—speaks its own unique language of performance. To get a real grip on your impact, you need to be fluent in all of them.
This means recognising that a stellar metric in one area might be completely useless in another. A high click through rate is fantastic for a Google Ad, but it tells you very little about the success of an organic social media post designed to build a community.
The goal is to measure each channel on its own terms. By breaking down your analysis channel by channel, you get a much clearer, more accurate picture of what’s driving results. It lets you allocate your budget with confidence, double down on what works, and fix what doesn’t.
Metrics for SEO and Content Marketing
When it comes to SEO and content marketing, the game is all about attracting an audience organically and building authority over time. The key metrics here are less about instant sales and more about sustained growth and engagement.
Your primary focus should be on how people find you and what they do once they arrive on your site.
- Organic Traffic: This is your bread and butter—the number of visitors who land on your website from a search engine like Google, not from a paid ad. It’s a direct indicator of your SEO health.
- Keyword Rankings: Tracking where you appear in search results for your target keywords shows if your SEO efforts are gaining traction. That jump from page two to page one can be a game changer for traffic.
- Bounce Rate: This shows the percentage of visitors who leave after viewing only one page. A high bounce rate can be a red flag, suggesting your content isn't what the searcher was looking for.
- Time on Page: A simple but powerful metric. It measures how long visitors stick around on a specific page, and longer times generally mean your content is valuable and engaging.
Metrics for Paid Advertising (PPC)
Paid advertising, or Pay-Per-Click (PPC), is a different beast entirely. Here, you’re spending money directly to get in front of customers, so your metrics need to be laser focused on efficiency and return on investment.
Every pound spent has to be justified. The massive growth in digital ad spend proves just how crucial this is. UK businesses poured £15.57 billion into these channels back in 2020, and the industry is projected to hit revenues of around £40.9 billion by 2025.
When you're paying for every click, you can't afford to guess. The right paid advertising metrics tell you exactly how much it costs to get a new customer and whether that cost is sustainable.
Here’s what to keep a close eye on:
- Cost Per Acquisition (CPA): This is the bottom line: your total ad spend divided by the number of conversions. It tells you exactly how much you paid to win one new customer.
- Return on Ad Spend (ROAS): The ultimate measure of profitability. It calculates the revenue generated for every pound spent on ads. A ROAS of 4:1 means you made £4 for every £1 spent. Simple.
- Click-Through Rate (CTR): The percentage of people who saw your ad and actually clicked it. A high CTR is a strong signal that your creative and targeting are hitting the mark.
- Conversion Rate: This tracks the percentage of clickers who go on to complete your desired action, like making a purchase. It shows how well your landing page closes the deal.
Metrics for Social Media Marketing
Social media is often a mix of brand building and direct response, so your metrics need to reflect that duality. Some of your posts are there to start a conversation, while others are designed to drive clicks and sales.
The biggest mistake you can make is chasing vanity metrics like follower count. A huge following means nothing if nobody is actually listening.
Instead, concentrate on numbers that show real interaction and interest:
- Engagement Rate: This is arguably the most important social metric. It measures likes, comments, shares, and saves as a percentage of your audience, proving your content is interesting enough for people to act on.
- Reach and Impressions: Reach is the number of unique people who see your content; impressions are the total number of times it was displayed. These are your go to metrics for gauging brand awareness.
- Social Referrals: This tracks how much traffic your social channels are sending to your website. It’s a clear sign that your content is successfully pushing people to take the next step.
Metrics for Email Marketing
Email remains one of the most powerful channels out there, giving you a direct line to your most engaged audience. The metrics here are all about how your subscribers respond when you land in their inbox.
- Open Rate: The percentage of people who opened your email. It’s a solid indicator of your subject line’s power and your brand’s recognition.
- Click-Through Rate (CTR): Of those who opened your email, what percentage clicked on a link inside? This shows your message and call to action were compelling.
- Conversion Rate: This connects your email directly to revenue. It’s the percentage of people who clicked a link and then completed a desired action, like buying a product.
- Unsubscribe Rate: The percentage of recipients who opt out. A consistently high rate is a massive red flag that your content just isn't hitting the mark.
To see how these channels can work in harmony, our guide on maximising ROI with multi-channel marketing offers a strategic approach. And for those using a highly targeted sales strategy, exploring these crucial Account Based Marketing (ABM) metrics is a must.
How to Turn Raw Data into Actionable Insights
Collecting marketing data is a bit like gathering ingredients for a new recipe. A countertop piled high with fresh vegetables and spices is a great start, but it isn’t dinner. The magic happens when you know how to prepare and combine them. In the same way, raw data is just potential—its real power is unlocked when you start interpreting it.
The goal here is to shift from just collecting numbers to making genuinely smart decisions that push your business forward. This means digging deeper and asking the tough "why" questions. Why did our web traffic shoot up last month, but our conversion rate took a nosedive? And why is one email campaign completely blowing another out of the water?
This is how abstract performance metrics get translated into a clear, compelling story. It helps you understand what’s really going on under the bonnet, linking your marketing spend directly to revenue and growth.
Analysing Trends and Patterns
Your data isn't a static snapshot; it tells a story that unfolds over time. The first step in finding those game changing insights is to simply look for trends. A single month’s data could easily be a fluke, but a six month trend? That’s a pattern you can act on.
Keep an eye out for consistent upward or downward movements in your key metrics. Is your organic traffic climbing steadily? Are your email open rates slowly but surely declining? Spotting these patterns is how you start to see the bigger picture.
Once you’ve identified a trend, the real work begins: investigating the cause. A sudden drop in traffic, for instance, might be down to a Google algorithm update or a sneaky technical issue on your site. Context is everything.
Segmenting Your Audience for Deeper Understanding
Your customers aren't all the same, so why would you analyse their behaviour as if they were one giant, faceless group? This is where audience segmentation comes in. It’s simply the process of dividing your audience into smaller, more focussed groups based on shared characteristics, and it’s a critical step in unearthing powerful insights.
You can slice and dice your audience in countless ways:
- By Demographics: Grouping by age, location, or gender.
- By Behaviour: Separating first time visitors from loyal returning customers, or big spenders from one off buyers.
- By Acquisition Channel: Comparing how customers from social media behave versus those who found you through a Google search.
Segmenting your data shows you exactly how different groups interact with your marketing. You might discover that your younger audience loves video content on social media, while older customers prefer in depth, informative blog posts. To get the most out of your efforts, mastering B2B marketing analytics is non-negotiable for extracting these kinds of meaningful insights.
An insight isn't just an observation; it's a discovery that demands action. Finding out that 70% of your mobile traffic bounces is an observation. Realising it’s because your checkout page is broken on mobile phones? That's an actionable insight.
This is where you need to blend the hard numbers with human feedback. The UK's market research industry, estimated to be worth £6.4 billion in 2024, is built on providing these deeper insights into consumer behaviour and campaign effectiveness. This kind of data helps businesses connect the dots and understand the story behind the statistics.
Connecting Actions to Outcomes with Attribution
Finally, marketing attribution is all about connecting the dots. It’s how you figure out which marketing channels or touchpoints get the credit for a sale or conversion. Without it, you’re just guessing which of your efforts are actually making a difference.
Imagine a customer journey: they see your ad on Facebook, read a blog post a week later, and then finally buy something after clicking a link in your newsletter. So, which channel gets the credit? Attribution models are designed to answer that exact question.
Different models assign credit in different ways:
- First-Touch Attribution: Gives 100% of the credit to the very first interaction.
- Last-Touch Attribution: Gives all the credit to the final touchpoint right before the conversion.
- Multi-Touch Attribution: Spreads the credit across multiple touchpoints along the customer’s path.
Choosing the right model really depends on your business and the length of your sales cycle. The main takeaway is to understand how all your channels work together to guide customers toward a purchase. Once you can correctly attribute conversions, you can start optimising your budget and putting more fuel into the channels that deliver the best results. Our guide on harnessing the power of data-driven marketing digs deeper into strategies for turning your data into tangible success.
Creating Marketing Reports That Drive Action

A great marketing report does more than just present numbers; it tells a story. It’s the difference between showing someone a spreadsheet and showing them a map of where we’ve been, where we are, and where we need to go next.
Dropping a raw data file into someone’s inbox is a guaranteed way to make sure it never gets looked at. The real skill lies in turning that data into a clear narrative that everyone—from your colleagues in the marketing trenches to the board of directors—can actually understand and use.
The best reports are built on clarity and purpose. They summarise what happened, pull out the most important findings, and, most critically, recommend what to do next. That forward thinking approach is what separates a document that gets filed away from one that genuinely steers the business.
Tailoring Your Report to the Audience
Not everyone cares about the same metrics. The level of detail you share should change dramatically depending on who’s reading the report. Bombarding the executive team with channel specific jargon is just as useless as giving your social media manager a vague, high level overview.
Effective reporting is about giving each person exactly what they need to make better decisions.
- For the Marketing Team: This is where you get granular. Dive deep into campaign performance, A/B test results, and specific channel metrics. This is the stuff that helps you fine tune the tactics for the coming weeks.
- For Senior Management: Focus on the big picture KPIs that tie directly to business goals. They need to see the return on investment ( ROI ), customer acquisition cost (CAC) , and the overall impact on revenue.
- For the C-Suite or Board: Keep it strategic and concise. Highlight the major wins, explain how marketing is fuelling top level business objectives, and outline the future strategy in broad strokes.
A report's true value is measured by the quality of the conversation it starts. If it doesn't lead to questions, ideas, and decisions, it has failed, no matter how much data it contains.
Essential Components of a Powerful Report
To make sure your report is both clear and compelling, build it around a few core components. This creates a logical flow that guides your audience from the big picture down to the important details without losing them along the way.
- Executive Summary: Start with a short, sharp overview right at the top. State the key results and main takeaways in just a few sentences. No fluff.
- Key Findings & Insights: This is where you go beyond the numbers. Explain why you think things happened and what you’ve learned from the data. What was surprising? What was unexpected?
- Effective Data Visualisation: Use simple charts and graphs to make complex information easy to digest. A clean bar chart almost always beats a crowded table of numbers.
- Actionable Recommendations: This is the most crucial part. Based on everything you've just shown, what should the business do now? Propose clear, specific next steps.
Plenty of modern tools can help automate this process, pulling data from all your different sources into clean, visual dashboards. This doesn't just save a massive amount of time; it also keeps your reporting consistent and accurate.
By building reports that tell a clear story, you turn marketing performance metrics from a list of passive numbers into an active tool for driving success.
Building a Culture of Continuous Improvement
Getting a handle on your marketing metrics isn't a one off job; it’s a commitment. Real, lasting success comes from building a data first mindset right into the fabric of your organisation, where performance analysis becomes a constant cycle of learning and adapting.
This approach turns your metrics from a rear view mirror into a forward looking guide. It gives your team the power to use data proactively, spotting opportunities and fixing weaknesses long before they turn into major problems. The goal is to stop just looking back at what happened and start innovating based on what the numbers are telling you is possible.
Fostering a Data-First Mindset
Creating this kind of culture starts with making data accessible and easy to understand for everyone. It means encouraging curiosity and giving a nod to the team members who are always digging into the "why" behind the numbers.
When your team sees how marketing performance metrics directly lead to better creative, smarter spending, and stronger campaigns, they get invested. This shared approach makes everyone feel responsible for driving results, turning data analysis from a chore into a shared mission.
The most effective marketing teams don't just report on data; they live in it. They use metrics to fuel experimentation, challenge assumptions, and consistently elevate their impact on the business.
Your Checklist for Improvement
To put all this into practice, start by taking a hard look at your measurement strategy today. A regular audit of your metrics and processes is the only way to make sure you stay focussed on what truly matters.
Here’s a simple checklist to get you started:
- Review Your KPIs Quarterly: Are your key performance indicators still lined up with your main business objectives? Business goals change, and your metrics have to change with them.
- Encourage Experimentation: Create a safe space for your team to test new ideas. Use A/B testing on everything from ad copy to landing pages and let the data decide the winner.
- Automate Reporting: Get dashboard tools to do the heavy lifting on data collection. This frees up your team from the grind of manual reporting so they can focus on the real value: analysis and strategy.
- Hold Regular Performance Reviews: Schedule weekly or bi-weekly meetings purely to discuss the metrics. What worked? What didn’t? What are we going to do differently next week?
Got Questions? We've Got Answers
Getting to grips with marketing performance metrics can feel a bit like learning a new language. It’s easy to get lost in the jargon, but a few key ideas can make everything click into place. Let's clear up some of the most common questions.
What’s the Real Difference Between a Metric and a KPI?
Think of it this way: a metric is any data point you can track, while a Key Performance Indicator (KPI) is a metric you’ve hand picked because it shows you’re making real progress towards a critical business goal.
For example, ‘website page views’ is a metric. It’s useful information, telling you how many times a page was seen. But if your main goal is to generate sales leads, your KPI is the ‘landing page conversion rate’. While page views are nice to know, the conversion rate is the number that actually tells you if you're winning.
A metric measures an activity. A KPI measures the impact of that activity on a core business objective. Not every metric deserves to be a KPI.
How Often Should I Be Checking My Marketing Metrics?
There’s no one size fits all answer here. The right rhythm for checking your numbers depends entirely on the metric and the channel. Checking everything daily is a surefire way to get overwhelmed and make kneejerk decisions based on tiny fluctuations. A structured approach is much smarter.
Here’s a practical way to think about it:
- Daily or Weekly: This is for your fast moving channels, like paid ad campaigns ( PPC ). You need to keep a close eye on metrics like Cost Per Acquisition (CPA) and Return on Ad Spend (ROAS) to quickly tweak budgets and creative for better performance.
- Monthly: Slower burn strategies like SEO and content marketing are best reviewed monthly. This gives you enough time to spot meaningful trends in organic traffic, keyword rankings, and audience engagement, without overreacting to the daily ups and downs.
What Are the Biggest Mistakes People Make with Marketing Measurement?
Avoiding a few common tripwires is crucial if you want your data to give you accurate insights. Three mistakes, in particular, tend to trip up marketers and water down their efforts to prove their value.
First, getting distracted by vanity metrics . Things like social media follower counts look impressive on the surface but often have no real connection to business outcomes. Second is failing to segment data . Lumping your entire audience together hides golden nuggets of insight about specific customer groups.
But the biggest error of all? Not linking marketing metrics back to wider business goals . Your marketing report should always tell a story about how your work is driving revenue, boosting customer loyalty, or building the brand. Without that connection, your data is just noise.
Ready to stop guessing and start growing? The expert team at Superhub specialises in building data driven strategies that deliver real, tangible results. Let's talk about taking your brand's performance to the next level.
Want This Done For You?
SuperHub helps UK brands with video, content, SEO and marketing that actually drives revenue. No vanity metrics. No bullsh*t.