
Measuring Marketing Effectiveness: A Practical Guide
Before you can even think about measuring marketing effectiveness, you have to answer one simple question: what does success actually look like for your business?
It’s about setting clear, measurable goals tied directly to commercial outcomes. This ensures every marketing pound you spend has a purpose, and you can actually track its impact.
Building a Solid Foundation for Measurement

Before you get lost in complex analytics or fixate on a single metric, you need to build a solid foundation. It is the most important step.
Without clear objectives, any data you collect is just noise. It offers no real direction or insight into how you are performing. The aim here is to move beyond superficial numbers and get a real handle on how your marketing is contributing to business growth.
This means you need to get crystal clear on the difference between your broad strategic goals and your specific tactical objectives. Think of it like building a house: the strategic goal is the finished home, while the tactical objectives are laying the foundation, framing the walls, and sorting the plumbing.
Differentiating Strategic Goals from Tactical Objectives
Strategic goals are the big picture ambitions that line up with the company's overall vision. They answer the question, "What are we ultimately trying to achieve as a business?"
A few examples of strategic goals might be:
- Increase our overall market share by 10% in the next fiscal year.
- Become the recognised market leader in the automotive parts sector.
- Achieve 20% year on year growth in total revenue.
Tactical objectives, on the other hand, are the specific, measurable marketing actions you’ll take to hit those strategic goals. They are the practical steps that connect your day to day marketing activities to the bigger picture.
So, if your strategic goal is to increase market share, your tactical objectives might look something like this:
- Boost website conversions from organic traffic by 15% within six months.
- Generate 500 marketing qualified leads (MQLs) from our new social media campaign this quarter.
- Reduce customer churn by 5% through a targeted email retention programme.
This clear mapping makes sure that every single campaign—from a one off social media post to a huge advertising push—has a defined purpose that supports a larger commercial outcome. It stops the team from chasing vanity metrics, like social media likes, that have no real impact on the bottom line.
A common mistake is to confuse activity with progress. Sending 10,000 emails is an activity; increasing customer lifetime value through that email campaign is progress. Your measurement framework must focus on the latter.
The Role of Budget in True Effectiveness
While tracking Return on Investment (ROI) is obviously important, it is not the only thing that determines success. In fact, it might not even be the most important.
Research from the IPA Effectiveness Conference gave UK marketers some serious food for thought. Analysis showed that variations in profit outcomes were roughly 89% down to the size of the budget, while only 11% was attributable to ROI measures.
Despite this, 65% of senior marketers surveyed believed ROI was the most critical factor. This misconception often leads to overly narrow targeting and a focus on short term performance media over long term brand building, which can shrink a campaign's scope and, ultimately, its profits. You can read more about these IPA findings and their implications for UK marketers.
What this really highlights is the need to set realistic objectives that are backed by an adequate budget. A tiny budget aimed at a massive strategic goal is set up to fail, no matter how well you measure its ROI.
So, your foundational work must involve not just defining success, but also realistically resourcing the journey to get there. This grounds your measurement strategy in reality and gives you a true, fair assessment of your marketing performance.
Choosing Metrics and KPIs That Actually Matter
Once your objectives are nailed down, the real work begins: picking the Key Performance Indicators (KPIs) to track your progress. This is a classic tripwire. Too many teams get seduced by vanity metrics—the kind that look great in a report but have zero connection to actual business results.
Truly effective measurement is about choosing metrics that tell the whole story. To do that, you first need to get your head around two different types of indicators: leading and lagging. Getting this right is fundamental to building a measurement framework that works.
Leading Versus Lagging Indicators
Think of a leading indicator as a predictive measure. It’s an early signal that suggests future success, kind of like a canary in the coal mine for your marketing campaigns. These are often top of funnel numbers that tell you if you’re reaching the right people and grabbing their interest.
A lagging indicator , on the other hand, measures what’s already happened. These metrics confirm whether your strategy hit the mark, focusing on the final outcomes. They’re easier to measure but much harder to influence in the moment because they reflect the sum of all your past actions.
For example, a sudden spike in website traffic (a leading indicator) could signal a future lift in sales revenue (a lagging indicator). By keeping a close eye on your leading indicators, you give yourself the chance to tweak campaigns before the final results are locked in.
Creating a Balanced KPI Dashboard
If you lean too heavily on one type of indicator, you’ll get a warped view of reality. A dashboard packed with leading metrics like social media likes might give you a false sense of security. But focusing only on lagging metrics like profit leaves you with no room to manoeuvre.
A balanced dashboard gives you the full picture, from initial brand awareness all the way through to customer loyalty.
Your dashboard should be a healthy mix of metrics like these:
- Awareness Metrics: Brand search volume, share of voice, website traffic. These tell you if people are noticing you.
- Engagement Metrics: Click through rate (CTR), average session duration, social interactions. These show if your message is actually landing.
- Conversion Metrics: Conversion rate, cost per acquisition (CPA), lead to customer ratio. The bridge between marketing activity and money in the bank.
- Revenue Metrics: Return on investment (ROI), customer lifetime value (CLV), sales revenue. The ultimate proof of success.
By tracking a blend like this, you start to see how actions at the top of the funnel directly impact the bottom line. For a much deeper dive, check out our complete guide on how to measure ROI for UK marketers.
Selecting Nuanced Metrics for Deeper Insights
The secret to really effective measurement is to go beyond the obvious, surface level numbers. For instance, anyone can track ‘Cost Per Lead’ (CPL). A far more powerful metric is Cost Per Qualified Lead (CPQL) .
A low CPL looks great on paper, but it’s completely worthless if those leads are duds. Shifting your focus to CPQL forces you to assess lead quality , not just quantity. It instantly aligns your marketing goals with what the sales team actually needs.
Choosing the right KPIs isn’t just about measurement; it is about driving the right behaviours. When your team is focused on CPQL, they will optimise campaigns to attract prospects with genuine buying intent, not just clicks.
This same principle applies everywhere. Always be on the lookout for metrics that provide deeper context and tie directly back to your business goals.
The data backs this up. A recent survey of UK businesses showed that 54% view increasing sales revenue as a top priority. It’s no surprise, then, that sales was ranked the most valuable metric by 22% of UK marketers, followed by social media engagement ( 20% ) and website traffic ( 18% ).
Interestingly, only 7% prioritised ROI as their number one metric, suggesting a strong preference for direct performance indicators over complex calculations. This just reinforces the need to link your chosen KPIs directly to the outcomes your business truly values.
Building Your Data Collection and Analytics Stack
Any conversation about effective measurement has to start with trustworthy data. And trustworthy data starts with the right tools.
Building a solid marketing technology (martech) stack isn’t about chasing the latest shiny software. It is about piecing together a unified system that gathers, sorts, and makes sense of information from every single customer touchpoint.
The real goal here is to create a single source of truth. That means linking up your various platforms to map out the entire customer journey—from the first ad they saw to their latest purchase—without any of the details getting lost along the way.
Core Components of a Modern Martech Stack
To get a genuinely complete view of your marketing performance, you need to be pulling data from a few key places. A well built stack almost always includes tools for web analytics, customer relationship management, and channel specific monitoring.
Think of how these pieces fit together to give you the full picture:
- Web Analytics Platforms: This is your foundation. Tools like Google Analytics 4 (GA4) are non-negotiable for tracking user behaviour on your website. They show you where people are coming from, what pages they’re looking at, and how they’re interacting with your content.
- Customer Relationship Management (CRM) Systems: A CRM like HubSpot or Salesforce is your customer database. It’s where you track every interaction, purchase, and conversation, giving you a detailed history of each relationship.
- Social Media and SEO Tools: Platforms like Semrush or Sprout Social are vital for keeping an eye on specific channels. They give you the context you need by tracking keyword rankings, social engagement, and what your competitors are up to.
The magic happens when you integrate these systems. For instance, connecting your CRM to your web analytics doesn’t just show you which campaigns drove traffic; it tells you which ones brought in your most valuable, long term customers. That is the difference between just marketing and marketing effectively.
Ensuring Data Accuracy and Cleanliness
Let’s be blunt: your insights are only as good as the data you feed them. Inaccurate or messy data leads to bad decisions and wasted money. Keeping your data clean isn’t just good practice; it is essential.
One of the simplest yet most powerful ways to maintain data integrity is by using UTM parameters . These are just little tags you add to your URLs that tell your analytics exactly where a visitor came from. A consistent UTM strategy lets you attribute conversions accurately to specific campaigns, channels, and even individual ads.
Think of your data stack like a well organised library. If every book (data point) is correctly labelled and shelved (tracked and attributed), finding what you need is easy. Without that system, you’ve just got a chaotic pile of paper.
And for any business where phone calls are a key part of the sales process, using PPC call tracking is critical. It closes a huge gap that often exists between online clicks and offline conversions, ensuring you get credit where it is due.
Choosing the Right Analytics Platforms
There’s no one size fits all answer when it comes to analytics tools. The best platform for you will come down to your budget, your team's skills, and your specific business goals.
When you are weighing up the options, keep these three things in mind:
- Scalability: Can this tool grow with you? What works for a small startup might crumble under the demands of a larger enterprise.
- Integration Capabilities: How easily does it talk to the other software in your stack? You need seamless connections to build that single source of truth we talked about.
- Ease of Use: A tool is useless if your team cannot figure it out. Look for platforms with intuitive dashboards and solid customer support.
Ultimately, your tech stack is the engine that drives your entire measurement framework. When you choose your tools carefully and integrate them properly, you turn raw data from a liability into your greatest strategic asset. To see how this works in practice, you might be interested in our guide to harnessing the power of data-driven marketing strategies for success.
How to Analyse and Interpret Your Marketing Data
Collecting endless streams of data is one thing; turning that raw information into a clear story is where the real value lies. Your analytics tools are great at gathering the numbers, but they cannot connect the dots for you. This is where you, the marketer, come in—transforming complex datasets into clear, actionable insights.
The goal is to move beyond simply reporting what happened and start uncovering why it happened. For instance, knowing your conversion rate dropped by 5% is interesting. But knowing it was driven entirely by a decline in mobile traffic from a specific ad channel? Now that’s an insight you can actually do something with. This is the skill that separates good marketing from great marketing.
Uncovering Truths Through Segmentation
Looking at your data as one big, monolithic block is one of the most common mistakes I see. Top level metrics often hide the crucial details and can easily lead you to the wrong conclusions. This is where segmentation comes in—breaking down your data into smaller, more focused groups to spot the patterns you would otherwise miss.
You can slice and dice your audience and performance data in countless ways:
- By Demographics: How do different age groups, genders, or locations interact with your campaigns?
- By Behaviour: Group users based on what they do. Think first time visitors versus returning customers, or people who view specific product pages.
- By Traffic Source: Compare the performance of your organic search, paid social, email marketing, and direct traffic. Which channels are pulling their weight?
- By Device: Differentiate between desktop, mobile, and tablet users to understand their unique experiences and frustrations.
Imagine you discover that while your overall email open rate is healthy, the click through rate for subscribers over 45 is lagging. This specific insight allows you to test different content or offers for that segment, rather than overhauling your entire email strategy based on a misleading average.
Using Attribution to Really Understand the Customer Journey
Hardly any customer sees a single advert and immediately buys. Their journey is almost always a winding path involving multiple touchpoints across various channels. Attribution modelling is the framework you use to assign credit for a conversion to these different touchpoints.
Choosing the right model is vital because it directly shapes how you value each channel. A flawed model can trick you into cutting the budget for a channel that plays a crucial, early stage role in building awareness, simply because it does not get the final click.
The most dangerous assumption in marketing is that the last click tells the whole story. Effective attribution acknowledges the entire journey, from the first spark of interest to the final conversion, giving you a much truer picture of what’s working.
Understanding the different models is the first step. Each tells a slightly different story about your customer's path to purchase.
Common Marketing Attribution Models Compared
Here’s a quick comparison of some common models to help you understand their differences and where they shine.
| Attribution Model | How It Works | Best For | Potential Pitfall |
|---|---|---|---|
| First Interaction | Gives 100% of the credit to the very first touchpoint a customer had with your brand. | Businesses focused on top of funnel brand awareness and lead generation. | It completely ignores all the interactions that nurtured the lead towards conversion. |
| Last Interaction | Assigns all the credit to the final touchpoint before the customer converted. | Companies with short sales cycles and those wanting to know what closes the deal. | It undervalues the channels that introduced and educated the customer initially. |
| Linear | Spreads the credit equally across every single touchpoint in the customer's journey. | Marketers who want a balanced view and value every interaction along the path. | It can assign equal importance to a minor touchpoint and a major decision driver. |
| Time Decay | Gives more credit to the touchpoints that happened closer in time to the conversion. | Brands with longer consideration phases, as it values the final nurturing steps. | It might undervalue the initial awareness building channels that started the journey. |
Ultimately, there is no single "best" model. The right choice depends entirely on your business goals, sales cycle, and customer behaviour. My advice? Experiment with different models to see which one provides the most logical and actionable insights for your campaigns.
For a deeper dive into gathering and dissecting data to understand campaign performance, you can explore this excellent guide on B2B marketing analytics. It’s a genuinely helpful resource, especially if you are operating in a B2B context.
Turning Insights Into Campaign Optimisations
All the hard work of measuring your marketing effectiveness comes down to this one crucial phase: taking action.
Let's be honest, data analysis that does not lead to meaningful change is just a pointless academic exercise. The real power of measurement isn't just about looking back at what happened; it's about creating an engine for future growth by turning those insights into concrete campaign improvements.
This means shifting your mindset from just reporting numbers to fostering a culture of continuous improvement. It’s about building a feedback loop where you consistently measure, analyse, report, and then—most importantly—refine your approach. This is how measurement stops being a chore and becomes a proactive strategy for success.
From Data Points to Actionable Narratives
The first hurdle is presenting your findings in a way that people can actually understand and use. Raw data tables and complex spreadsheets are enough to make anyone’s eyes glaze over, whether they're on your marketing team or in the boardroom.
The key is to build dashboards and reports that don't just show metrics but tell a story. They need to clearly highlight performance against the goals you set and offer unambiguous recommendations for what to do next.
A good report answers three simple questions:
- What happened? (e.g., "Our conversion rate dropped by 15% last month.")
- Why did it happen? (e.g., "The drop was driven entirely by mobile users from our latest paid social campaign.")
- What should we do about it? (e.g., "We need to A/B test new landing page designs specifically for this mobile audience.")
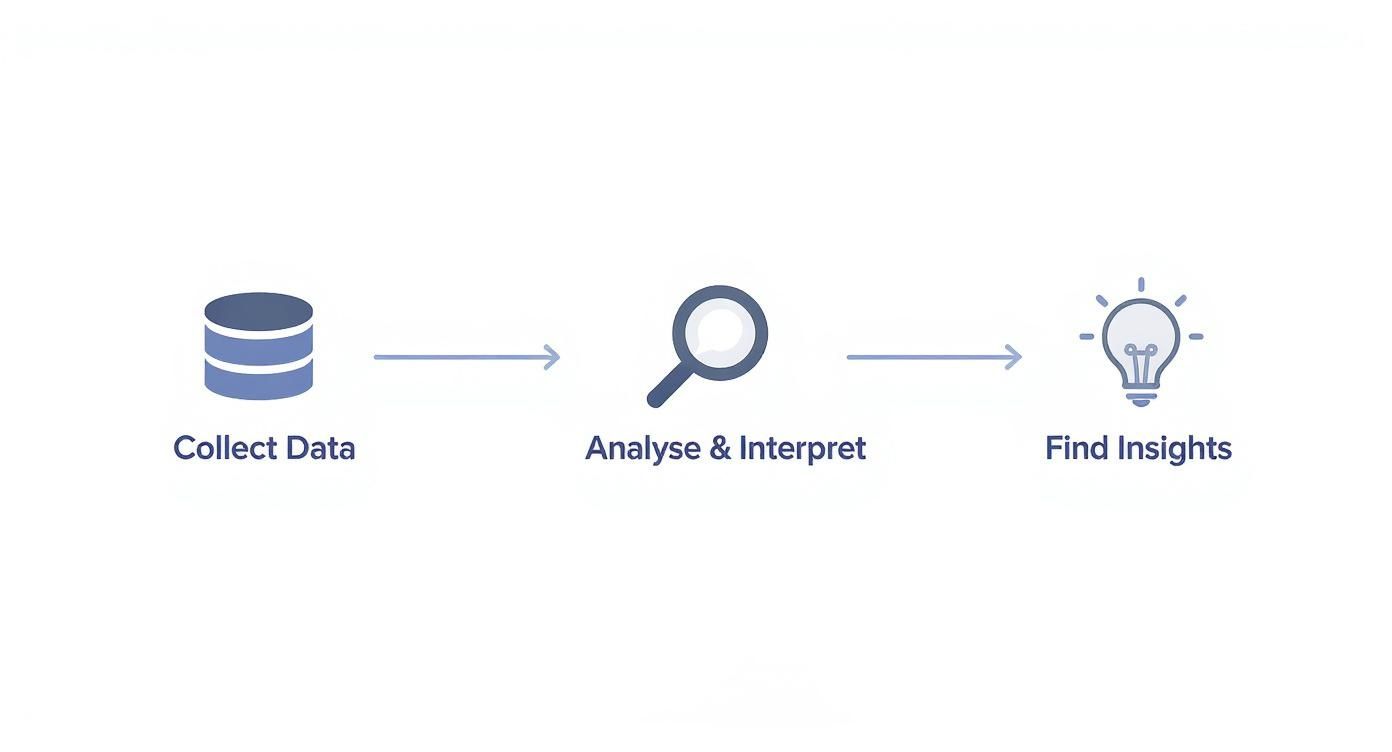
This structure turns passive observations into a clear plan. The graphic below shows how this flow works, taking raw data and turning it into those 'lightbulb moments' that lead to real change.
The Power of Systematic Experimentation
The most reliable way to improve campaign performance is through systematic experimentation, usually through A/B testing . This is not about guesswork; it is about making changes based on hard evidence. You isolate a single variable and test its impact on a specific metric.
For example, you might have a hunch that changing the call to action (CTA) button colour on a landing page from blue to orange will increase clicks. An A/B test is simple: show 50% of your visitors the original page (the control) and 50% the new version (the variation). By measuring the conversion rate of both, you get a clear, data backed answer on which performs better.
The secret to successful A/B testing is discipline. Only test one variable at a time. If you change the headline, the button colour, and the main image all at once, you’ll have no idea which change actually made the difference.
This experimental mindset should be applied across all your marketing. Whether you are refining email subject lines, social media ad copy, or landing page layouts, a structured testing framework provides the evidence you need to make smarter decisions. If you're looking to get started, our article on what is conversion rate optimisation is a great place to begin boosting your website's performance.
Applying Insights to Real-World Scenarios
Let's make this practical. The UK social media advertising market is projected to hit £9.95 billion , with around 79% of the UK population active on social platforms.
Imagine your data shows sky high engagement on your Instagram campaigns but disappointingly low conversion rates. Instead of just celebrating the likes and comments, a deeper dive might reveal your audience is primarily young adults ( 18-24 ) who spend tons of time online but have less disposable income.
The insight? While the channel is great for awareness, it is not driving sales for your high ticket item. Armed with this knowledge, you can now optimise. You could reallocate your budget to platforms where older, more affluent demographics hang out, or you could change your Instagram strategy to focus on brand building rather than direct sales.
By continuously applying insights this way, you create a powerful feedback loop. Every campaign, whether it flies or flops, provides valuable data that feeds into the next one, making your marketing progressively smarter and more effective over time.
Your Top Marketing Measurement Questions, Answered
Even with a perfect framework on paper, the real world of marketing measurement always throws up a few curveballs. It is completely normal.
Here, I'll tackle some of the most common questions we get from marketers. Think of this as your practical, no-fluff guide to clearing up confusion and proving your worth with confidence.
How Often Should I Be Measuring My Marketing?
There’s no magic number here. The right frequency depends entirely on the metric you’re looking at and how fast your campaign is moving.
For the quick fire stuff like paid social or search ads, you need to be in there weekly , if not daily . Metrics like click through rates and conversions can change in an instant, and you need to be ready to react.
But for the bigger, slower burning goals like brand awareness or customer lifetime value, a monthly or quarterly review makes more sense. Looking at these too frequently is like watching water boil; you won’t see meaningful change, and you will just drive yourself mad.
The key is to find a rhythm. A good rule of thumb is a quick tactical check in each week for active campaigns, followed by a deeper strategic review once a month to see how you are tracking against the big business objectives.
What’s the Real Difference Between Marketing ROI and ROAS?
People throw these terms around interchangeably, but they measure two very different things. Nailing the distinction is vital for reporting accurately on your performance.
ROAS (Return on Ad Spend) is a pure, tactical metric. It tells you the gross revenue you generated for every single pound you spent on an ad campaign. The formula is simple: Revenue from Ads / Total Ad Spend . It’s brilliant for a quick health check on a specific ad or campaign.
Marketing ROI (Return on Investment) , on the other hand, is the strategic heavyweight. It measures the overall profitability of everything you do in marketing. This calculation includes all the associated costs – software, salaries, agency fees, the lot. The formula is: (Revenue - Total Marketing Cost) / Total Marketing Cost .
A high ROAS is great for knowing an ad is working, but a strong ROI is what proves to the board that marketing is a profit centre, not a cost centre. Use ROAS for in the moment tweaks and ROI for the big picture conversations.
How Do I Even Begin to Measure Offline Marketing?
Measuring things like print ads, radio spots, or event sponsorships is definitely trickier than tracking a digital click, but it’s far from impossible. You just need to be a bit creative.
Here are a few tried and tested methods we use:
- Unique Promo Codes: Create a specific discount code for each offline campaign. "MAGAZINE20" for a print ad or "EVENT15" for a trade show. It is a dead simple way to trace sales directly back to the source.
- Dedicated Phone Numbers: Use a call tracking service like CallRail to assign a unique phone number to each ad. This gives you concrete data on how many calls each channel is actually driving.
- Vanity URLs: Set up a simple, memorable URL (like yourwebsite.co.uk/offer) and use it only in one specific offline ad. You can then track visits to that page as direct responses to your campaign.
By layering these techniques, you can start building a clear picture of how your offline activities are contributing to your overall marketing mix.
What Exactly Are Vanity Metrics, and Why Are They So Bad?
Vanity metrics are the ones that look fantastic in a report but tell you absolutely nothing about the health of the business. They are the sugar rush of marketing data—they feel good for a moment but lack any real substance.
Classic examples include:
- Social media followers or likes
- Total website page views
- Number of email subscribers
The real danger here is that they trick you into making bad decisions. A campaign that gets thousands of likes but generates zero qualified leads is not a success; it is a distraction.
You need to shift your focus to actionable metrics . These are the numbers directly tied to your business goals: conversion rates , customer acquisition cost (CAC) , and customer lifetime value (CLV) . These are the metrics that tell the true story of your marketing effectiveness.
At Superhub , we build data driven marketing strategies that focus on one thing: delivering tangible results. If you’re ready to move beyond vanity metrics and build a measurement framework that truly proves your marketing's value, our team is here to help.
Find out how we can help your brand at https://www.superhub.biz.
Want This Done For You?
SuperHub helps UK brands with video, content, SEO and marketing that actually drives revenue. No vanity metrics. No bullsh*t.