

How to Calculate Marketing ROI in the UK
To work out your marketing ROI, you take the sales growth generated from a campaign, subtract the total cost of that campaign, and then divide the result by the cost.
It’s a simple formula: (Sales Growth - Marketing Investment) / Marketing Investment . But the result is a powerful percentage that shows you exactly how much return each marketing pound has generated for your business.
What Is Marketing ROI and Why Does It Matter?

Marketing Return on Investment (ROI) is the metric that tells you how profitable and effective your marketing campaigns really are. It answers the one question every business owner or manager needs to know: for every pound we put into marketing, how much revenue did we get back?
In short, it puts a real number on the financial impact of your marketing. This moves the conversation beyond vanity metrics like clicks or impressions and focuses it squarely on what actually matters—the bottom line. Understanding how to calculate marketing ROI is the first step in turning marketing from a cost centre into a proven revenue driver.
The Real Reason for Measuring ROI
Justifying your marketing spend is one of the biggest reasons to get a grip on ROI. When the finance team or the board asks what the business got in return for a campaign, a solid ROI figure gives them a concrete answer.
Instead of saying, "we got 5,000 clicks," you can confidently state, "we spent £20,000 and generated £80,000 in sales, delivering a 300% ROI ." This completely shifts the narrative from activity to outcome.
But it’s not just about defending your budget. Measuring ROI is what fuels smarter, data backed decisions. It tells you what’s actually working so you can put your resources where they’ll have the most impact.
- Optimise Your Budget: When you know which channels deliver the highest returns, you can confidently shift your spending towards what works and pull back from the tactics that are falling flat.
- Improve Future Strategies: Every ROI calculation is a learning opportunity. Over time, you’ll start to see patterns—which types of content convert best, which customer segments are most profitable, and where your next big win might be.
Marketing ROI isn't just about proving your worth; it's about improving it. It’s a clear, financial scorecard that guides your strategy and helps you make every marketing pound work harder.
Looking Deeper Than the Basic Formula
While the standard ROI formula is a brilliant starting point, a more sophisticated approach often gives you a truer picture, especially if you have a longer sales cycle or rely on repeat business. This is where metrics like Customer Lifetime Value (CLV) come into play.
A single campaign might show a modest return at first glance. But when you factor in the long term value of the new customers you’ve brought in, the numbers can look completely different.
Calculating ROI with CLV uncovers the sustained impact of your marketing. It helps you appreciate the long term health of your customer acquisition strategy rather than just focusing on short term campaign wins.
Gathering the Right Data for Your Calculation
Before you even touch a formula, you need solid data. The truth is, the accuracy of your marketing ROI calculation hangs entirely on the quality of the information you feed it. As the old saying goes: rubbish in, rubbish out.
Getting this part right is what separates a vague guess from a number you can confidently take to the board to justify your budget. It means being meticulous in tracking every cost and every return.
Identifying All Marketing Investment Costs
The first piece of the puzzle is your total Marketing Investment . This is so much more than just what you spend on ads. One of the most common mistakes I see is people forgetting certain costs, which leads to a dangerously inflated ROI figure.
To get the full picture, you need to track everything:
- Direct Costs: This is the obvious stuff. It covers your ad spend on platforms like Google Ads or LinkedIn, fees for agencies or freelancers, and the cost of any sponsored events.
- Tool Subscriptions: Do not forget the monthly or annual fees for your marketing software. We're talking about your CRM, email marketing platform, SEO tools, and social media schedulers. They all add up.
- Content and Creative Production: This bucket includes costs for graphic design, video production, copywriting, and any other assets you created specifically for your campaigns.
- Indirect Labour Costs: This one is often overlooked but absolutely critical. You need to estimate the slice of your marketing team's salaries dedicated to a specific campaign. If someone spends half their month on a project, half of their monthly salary is part of that campaign's cost.
An ROI calculation is only as trustworthy as its inputs. Overlooking hidden costs like tool subscriptions or the creative team's time will give you a dangerously misleading result. True accuracy requires a comprehensive view of every single pound spent.
Pinpointing Your Sales Growth
Once you have a firm grip on your costs, you need to accurately attribute sales growth to your marketing efforts. This is all about connecting the dots between a specific campaign and the revenue it pulled in. It’s where many businesses get stuck, but it’s fundamental to understanding your real return.
For e-commerce brands, this can be pretty straightforward. Using UTM parameters in your campaign URLs allows tools like Google Analytics to show you exactly which ad, email, or social post led to a sale. You can literally trace a customer's journey from the first click to the final purchase.
For B2B companies with longer sales cycles, it gets a bit more complex. You’ll need to pull data from your Customer Relationship Management (CRM) system. By making sure your sales team logs the lead source for every new opportunity, you can tie closed deals back to the marketing campaign that brought them in. This is a core part of harnessing the power of data driven marketing strategies for success.
And while we're on the topic of clean data, it’s worth noting that the same principles apply to other key metrics. For instance, knowing how to calculate share of voice without useless data relies on the same commitment to accuracy.
To help you get started, here's a breakdown of the essential metrics you'll need.
Key Metrics for an Accurate ROI Calculation
This table outlines the crucial data points you need, where you can typically find them, and why they’re so important for a reliable calculation.
| Metric | What It Is | Where to Find It | Why It Matters |
|---|---|---|---|
| Total Marketing Spend | The complete cost of your campaign, including ad spend, tools, creative, and salaries. | Accounting software, marketing budget spreadsheets, payroll records. | This is the "Investment" part of ROI. If it's incomplete, your ROI will be artificially high and misleading. |
| Gross Revenue | The total income generated from sales attributed to your marketing campaign. | CRM, e-commerce platform (e.g., Shopify), sales reports. | This is the raw return your campaign produced before accounting for the cost of goods sold. |
| Cost of Goods Sold (COGS) | The direct costs of producing the goods sold (materials, direct labour). | Accounting or inventory management systems. | You need this to calculate your net profit, which gives a much truer picture of your actual return. |
| Lead to Customer Rate | The percentage of leads generated by a campaign that convert into paying customers. | CRM, marketing automation platform (e.g., HubSpot). | Helps you understand campaign quality. High revenue from a low conversion rate might not be sustainable. |
| Customer Lifetime Value (CLV) | The total revenue a business can expect from a single customer account over time. | CRM, customer data platform (CDP), analytics tools. | This provides a long term view of ROI, showing the full value of acquiring a customer, not just the initial sale. |
| UTM Tracking Data | Parameters added to URLs to track the performance of specific campaigns. | Google Analytics, marketing automation tools. | Essential for attribution. It tells you exactly which channel, ad, or link generated the sale or lead. |
Gathering these data points might feel like a lot of work upfront, but it’s a non negotiable step. Without this foundation of clean, comprehensive data, any ROI calculation you perform will be built on shaky ground.
Putting the ROI Formulas into Practice
Right, you’ve got your data organised. Now it’s time to plug those numbers into the formulas that really tell the story of your marketing spend. Calculating ROI isn't just some academic exercise; it's about seeing exactly how your investment is fuelling growth.
The simplest place to start is with the most fundamental formula. It gives you a clean, top level view of your return and it’s the perfect baseline for any business.
Basic ROI Formula:
(Sales Growth - Marketing Investment) / Marketing Investment
Let's run through a quick example. Imagine a UK based e-commerce brand selling artisan coffee. They decide to spend £5,000 on a targeted social media campaign for one month. In that time, their sales jump from a typical £20,000 to £35,000 . That’s a sales growth of £15,000 directly linked to the campaign.
Pop it into the formula: (£15,000 - £5,000) / £5,000 = 2
To turn that into a percentage, just multiply by 100. That gives you a 200% ROI . Not bad at all. For every £1 they spent, they made £2 back in profit.
Moving to a More Profitable Calculation
While the basic formula is a great starting point, it’s missing a crucial piece of the puzzle: the cost of the actual products you sold. To get a truer picture of your profitability, especially if you're selling physical goods, you absolutely have to factor in your Cost of Goods Sold (COGS) .
Profit Based ROI Formula:
(Sales Growth - COGS - Marketing Investment) / Marketing Investment
Let's go back to our coffee brand. Their COGS for that extra £15,000 in sales was £6,000 . By adding this cost into the mix, we get a much more honest view of how profitable that campaign really was.
The new calculation looks like this: (£15,000 - £6,000 - £5,000) / £5,000 = 0.8
This works out to an 80% ROI . It’s a very different number from 200%, but it’s far more realistic and gives you a much better foundation for making decisions. This infographic breaks down that essential data flow perfectly.
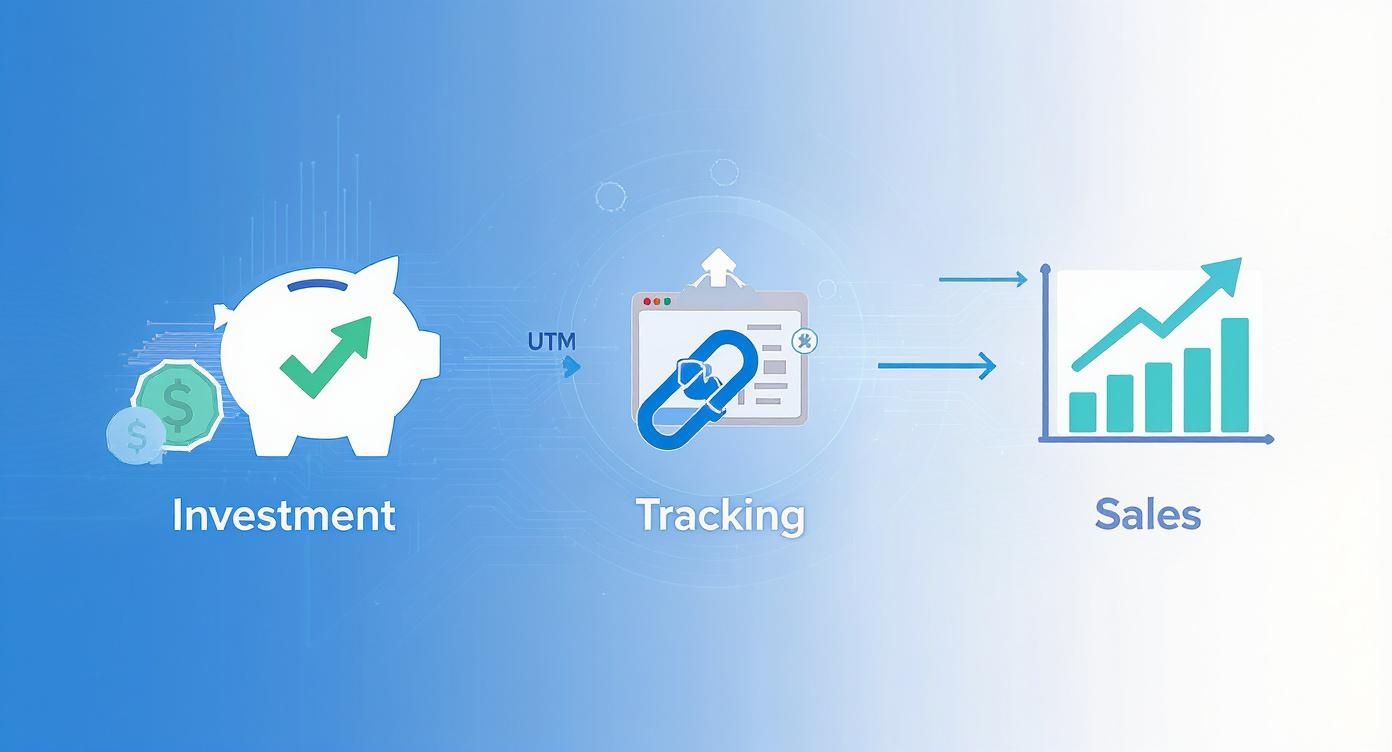
As you can see, it's a journey from tracking what you put in to measuring what you get out—the absolute core of any good ROI calculation.
Calculating ROI with Customer Lifetime Value
For B2B firms, subscription businesses, or any company that relies on repeat custom, the first sale is often just the beginning. The real prize is the long term relationship you build with a customer. This is where Customer Lifetime Value (CLV) becomes non negotiable for understanding your marketing's true impact.
Using CLV to calculate ROI forces you to shift your focus from short term wins to long term, sustainable growth. It shines a light on which campaigns are attracting your most valuable, loyal customers—not just one off buyers.
Think about a B2B software firm in Manchester. They invest £10,000 in a content marketing campaign which brings in five new clients. Each new client signs up for a £500 per month subscription.
- Initial ROI (first month):
((5 x £500) - £10,000) / £10,000 = -75%. Ouch, a clear loss. - ROI after 12 months:
((5 x £500 x 12) - £10,000) / £10,000 = 200%. Now we're talking. - ROI with a CLV of 36 months:
((5 x £500 x 36) - £10,000) / £10,000 = 800%. An incredible return.
This long term perspective changes everything. Research backs this up, showing that while UK marketers might see a short term profit ROI of £1.87 for every £1 invested , that figure more than doubles to £4.11 when the campaign's sustained effects are measured over time.
These different formulas show why context is king. A simple ROI is useful, but a deeper understanding comes from layering in profitability and long term value. For an even more focused view on specific ad campaigns, you should also learn how to calculate Return on Ad Spend (ROAS). Ultimately, a solid strategy for maximising ROI with multi-channel marketing will blend both immediate and long range measurements to guide your decisions.
How to Interpret Your ROI Results

So, you’ve gathered the data and done the sums. You have your ROI figure sitting there on the screen. A 250% ROI looks great, but what does it really mean for your business?
Turning that number into a genuine strategic advantage requires looking beyond the percentage. The real skill isn't just in the maths; it's about translating that figure into clear, actionable insights. Your result is a signpost, telling you where to double down, what needs a rethink, and how to defend your marketing budget with confidence.
What is a Good Marketing ROI Anyway?
It’s the first question everyone asks: "Is my ROI any good?" The honest, and slightly frustrating, answer is: it depends. There’s no magic number that works for everyone. Your industry, business model, and profit margins all play a massive role.
A commonly cited rule of thumb is that a 5:1 ratio (a 500% ROI) is a strong result. This means you’re generating £5 in revenue for every £1 you spend. But treat this as a guideline, not gospel.
- A software as a service (SaaS) company with high margins might find a 3:1 ROI is more than enough for sustainable, aggressive growth.
- An e-commerce business with much tighter margins might need to hit a 10:1 ratio just to stay comfortably profitable after factoring in the cost of their products.
The smartest move is to establish your own benchmarks. Start comparing your ROI against past campaigns and your own profitability targets. The real goal is continuous improvement, not just chasing an arbitrary industry average.
Using ROI Data to Make Smarter Decisions
Your ROI figures are a goldmine for strategic planning. They give you the hard evidence you need to allocate your budget where it will work hardest and fine tune future campaigns. Forget gut feelings; this is about letting the data guide your every move.
This is where your insights turn into action:
- Reallocate Your Budget: Pinpoint your most profitable channels. If your Google Ads are consistently pulling in a 7:1 ROI while your social media efforts are hovering around 2:1, that’s a crystal clear signal to shift more spend towards search.
- Optimise Underperformers: A low ROI doesn’t automatically mean you should ditch a channel. It could be a red flag for a problem with your messaging, targeting, or the offer itself. Use it as a prompt to dig deeper and test new approaches before pulling the plug.
- Justify Your Marketing Spend: The next time you present a budget proposal, lead with solid ROI data. The conversation instantly changes. You’re no longer just asking for money; you’re demonstrating how a specific investment will generate a predictable return, making it far easier to get that all important buy in.
Benchmarking Against Channel Performance
It’s important to remember that not all marketing channels are created equal. Their typical ROI performance varies wildly. Email marketing, for instance, consistently punches well above its weight for UK businesses.
Recent data shows that for every £1 spent on email marketing, UK businesses see an average return of £36 . That's a phenomenal 3,600% ROI . If you're curious about how this has evolved, you can discover key email marketing statistics on WebsiteBuilderExpert.com.
Your ROI figure is more than a metric; it's a compass for your entire marketing strategy. It tells you which paths are leading to profit and which are dead ends, allowing you to navigate with clarity and confidence.
Understanding these benchmarks helps you set realistic expectations and contextualise your own results. It explains why some of your efforts produce slow and steady returns while others deliver faster, higher gains. For a deeper look into evaluating your efforts, check out our guide on mastering marketing performance metrics.
Navigating the Murky Waters of ROI
Wouldn't it be great if every customer journey was a neat, straight line? They see an ad, they click, they buy. Job done.
But we all know that's not how it works. The reality is a messy, winding road filled with delays, countless touchpoints, and a whole load of activity that’s tough to pin a number on. Getting to grips with these real world obstacles is the only way to get a true, honest picture of how your marketing is actually performing.
One of the biggest headaches for UK marketers, especially in the B2B world, is the long sales cycle . You might create a brilliant piece of content in January that pulls in a lead, but that lead doesn't turn into a paying customer until August. If you attribute that sale only to the final email they clicked, you're completely ignoring the hard work that got them interested in the first place.
This delay is a massive attribution trap. If you measure your ROI too quickly, you’ll end up thinking your top of funnel campaigns are duds. You might even be tempted to cut the budget for the very activities that are quietly filling your pipeline for the months ahead. Your reporting window has to match your sales cycle—it’s non negotiable.
Untangling Complex Customer Journeys
Today’s buyers are everywhere. They might spot a social media ad on their phone, later search for a solution on Google and find your blog, click a link in an email newsletter, and then finally convert through a retargeting ad.
So, who gets the credit? This is exactly where basic, last click attribution models fall apart.
Relying on a last click model is like giving all the credit for a goal to the striker who tapped the ball in, ignoring the midfielder who made the crucial pass and the defender who started the whole play. It just doesn't show you the full game.
To get past this, you need to look at more sophisticated multi-touch attribution models . These models are designed to spread the credit across the different touchpoints that influenced the sale, giving you a much fairer view of what’s actually working.
Here are a few popular ways to approach it:
- Linear: Simple and fair. Every single touchpoint in the journey gets an equal slice of the credit. It’s a great starting point for acknowledging that every interaction had a role to play.
- Time Decay: This one’s all about momentum. It gives more credit to the touchpoints that happened closer to the sale, working on the assumption that the final interactions were the most persuasive.
- Position Based (U Shaped): A real favourite for a reason. This model gives the most weight to the first touch (the introduction) and the last touch (the conversion), typically 40% each . The remaining 20% is then shared out among all the interactions in between.
Measuring the 'Unmeasurable'
What about all the stuff that doesn't lead directly to a sale? Think content marketing, SEO, and brand awareness campaigns. These are the long game activities that build trust, authority, and recognition, making it far easier to convert people later on.
You can't just ignore them because they're hard to measure. Instead, you get creative with proxy metrics to estimate their value.
For SEO, track the growth of your organic traffic. Then, work out what you would have paid for that same traffic through paid ads. That's its baseline value. For content, look at metrics like newsletter sign ups from blog posts or how many people downloaded a gated e-book. Assign a value to each of those new leads, and you start to see the financial impact.
By adopting these more layered approaches, you’re moving away from simplistic sums and getting much closer to understanding the complete, true value your marketing brings to the business.
Your Key ROI Questions, Answered
Once you start digging into marketing ROI, a few key questions always seem to pop up. Let's tackle them head on, so you can move forward with a bit more clarity.
What Is a Good Marketing ROI in the UK?
Honestly, there’s no single magic number here. A ‘good’ ROI is completely different depending on your industry, business model, and profit margins.
But if you’re looking for a general benchmark, a 5:1 ratio is a solid target to aim for. That’s £5 in revenue for every £1 spent, or a 400% ROI .
This is just a guideline, though. A software company with high margins might be thrilled with a 3:1 return. On the other hand, a low margin e-commerce business might need to hit a 10:1 ratio just to see healthy growth. The real expert move is to set your own benchmark based on what profitability looks like for your business.
How Do You Measure ROI for SEO or Content Marketing?
This is where things get interesting. Trying to measure the ROI of long game strategies like SEO and content marketing is different. You can't just connect a specific ad spend to an immediate sale.
Instead, you need to look at the value you're building over a longer timeframe, say six to twelve months. It’s about tracking the right signals.
Here’s a practical way to estimate it:
- Track your organic traffic growth. How much would that same traffic have cost you if you’d paid for it through ads? That’s your first piece of value.
- Monitor leads from organic channels. Did someone download a guide from a blog post or fill out a contact form? Assign a monetary value to those leads.
- Value your keyword rankings. Estimate the revenue you could generate from ranking for high intent, commercial keywords. That’s tangible potential.
When you add up this estimated value and weigh it against what you’ve spent on your SEO and content efforts, you get a really solid, data backed picture of your return.
How Often Should You Calculate Marketing ROI?
The right answer depends entirely on your sales cycle and what you’re measuring. There’s no one size fits all schedule.
For fast paced activities like paid digital ad campaigns, you should be checking your ROI weekly or even monthly . This allows you to make quick adjustments, stop what isn’t working, and double down on what is.
For the bigger, slower burn strategies like content marketing or brand building, a quarterly review makes more sense. It gives these efforts enough time to actually bear fruit and gives you a more strategic, high level view of your progress.
Ready to transform your marketing from a cost centre into a predictable revenue engine? The expert team at Superhub specialises in creating data driven strategies that deliver measurable results. Discover how our digital marketing services can elevate your brand's performance.
Want This Done For You?
SuperHub helps UK brands with video, content, SEO and marketing that actually drives revenue. No vanity metrics. No bullsh*t.