Mastering Customer Lifetime Value Calculation
It’s easy to get bogged down in single-transaction metrics, but calculating customer lifetime value (CLV) is about playing the long game. It’s a forecast of the total net profit your business can realistically expect from a single customer across their entire relationship with you.
This single calculation is more than just a number; it’s a compass for steering your business towards real, sustainable growth.
Why CLV Is Your Most Important Business Metric
Forget chasing one-off sales or celebrating temporary spikes in conversion rates. Whilst those metrics have their place, they often paint a worryingly incomplete picture of your business's health.
The real insight into your company's long-term viability comes from a sharp focus on the Customer Lifetime Value calculation . It represents a fundamental shift in mindset—from purely transactional thinking to a relational strategy.
Think of it this way: a customer who makes a small initial purchase but comes back every month for five years is infinitely more valuable than a one-hit-wonder who makes a big purchase and disappears. Metrics like conversion rate treat both of them the same. CLV, on the other hand, shows you exactly where the sustainable profit is hiding.
A Compass for Strategic Decisions
A solid grasp of CLV acts as your guide for almost every part of the business, helping you make smarter, more profitable choices. It gives you a clear framework for answering the big questions that actually drive growth.
- Justifying Your Marketing Spend: How much can you really afford to spend to get a new customer? The CLV to Customer Acquisition Cost (CAC) ratio gives you a definitive answer, making sure your marketing budget is an investment, not a cost.
- Smarter Customer Segmentation: It lets you instantly spot your most valuable customer segments. You can then tailor your marketing, offers, and service levels to keep these high-value individuals happy and maximise their potential.
- Focusing Product Development: By seeing what your most profitable customers actually buy, you can make sharp, informed decisions about which products or features to develop next.
- Prioritising Customer Service: CLV helps you justify spending more on brilliant customer service. When you know that keeping a customer happy is worth hundreds or even thousands of pounds over their lifetime, providing excellent support becomes a no-brainer.
A business that obsesses over short-term sales is like a ship captain staring only at the waves hitting the bow. A business focused on CLV is like a captain using a compass and star chart to navigate towards a profitable destination.
The Shift to Long-Term Profitability
Ultimately, prioritising CLV means you stop renting customers and start building real relationships. This strategic shift creates a much more stable and predictable revenue stream for your business.
Companies that master their CLV calculation can weather market storms more easily because their growth is built on a foundation of loyal, repeat customers. To really get your head around the impact of this metric, check out this great piece on why increasing customer lifetime value is your secret weapon.
Understanding CLV is the first step. When you combine it with other key performance indicators, you get an even clearer view of your operational health. For a deeper dive, our guide on mastering marketing performance metrics gives you the essential context needed to build a truly data-driven strategy.
Choosing the Right CLV Calculation Method
So, you're sold on why Customer Lifetime Value matters. The big question now is how to actually calculate it.
Here’s the thing: there isn't one magic formula. The right approach for your business hinges entirely on the data you can get your hands on, your business model, and what you plan to do with the insights once you have them. Getting this right is crucial for accuracy.
Let's walk through the main methods, from the dead simple to the seriously sophisticated, so you can pick the one that gives you the sharpest intelligence for where your business is right now.
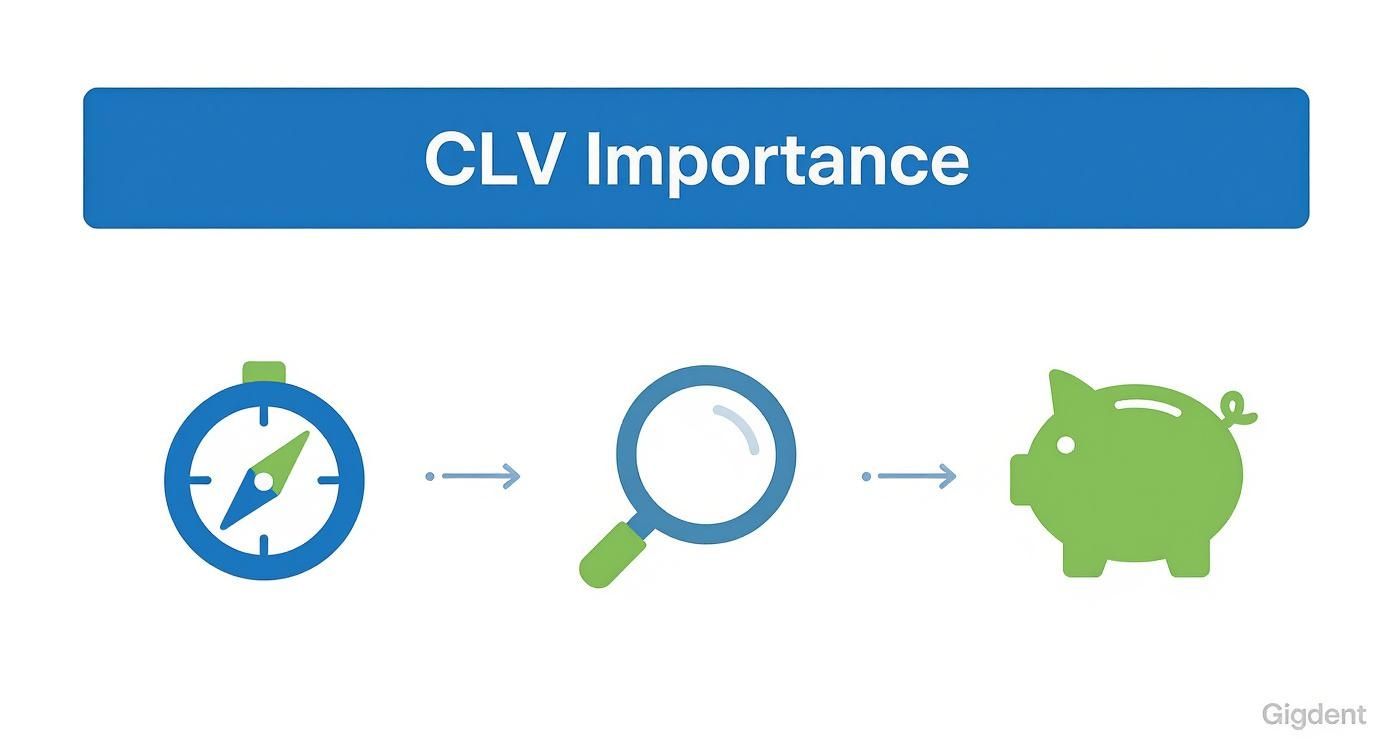
This is more than just a vanity metric. CLV acts as a compass for your strategy, a magnifying glass for spotting opportunities, and a direct line to healthier long-term profits.
Starting with Historic CLV
If you're just dipping your toes into this, the historic (or simple) CLV model is the perfect place to start. It does exactly what it says on the tin: it uses past data to work out the total gross profit a customer has generated so far. It’s wonderfully straightforward.
You don’t need fancy statistical software or enormous data sets. All it takes are three core metrics you're probably already tracking:
- Average Purchase Value (APV): Simply the average amount a customer spends per transaction. Just divide your total revenue over a period by the number of purchases in that same period.
- Average Purchase Frequency Rate (APFR): How often a customer buys from you. You can find this by dividing the number of purchases by the number of unique customers over a given time.
- Customer Lifespan (CL): The average time a customer sticks around before they stop buying.
Once you have those numbers, the formula is a simple multiplication:
Historic CLV = Average Purchase Value × Average Purchase Frequency Rate × Average Customer Lifespan
Let's imagine you run a UK-based online coffee subscription service.
- Your average customer spends £20 per order (APV).
- They order 12 times a year (APFR).
- Your subscribers tend to stay for 3 years (CL).
Your historic CLV calculation is £20 × 12 × 3 = £720 . This means that, on average, each new customer is worth £720 in revenue over their entire relationship with you.
Gaining Deeper Insights with Cohort Analysis
Historic CLV is a great starting point, but it has one major flaw: it lumps all your customers together into one homogenous group. In reality, some customers are far more valuable than others. This is where cohort analysis comes in, giving you a much more nuanced picture.
The most common approach is to group customers by when they were acquired – for example, the month or quarter they made their first purchase. By tracking these distinct groups (or cohorts) over time, you can see exactly how their behaviour and value evolve.
This technique uncovers powerful trends that a simple average would completely hide. You might discover that customers you acquired during a Christmas marketing push have a 20% higher average purchase value in their first year but are also quicker to churn than those you brought in over the summer.
Cohort analysis turns a single, flat CLV number into a dynamic story. It shows you which marketing initiatives brought in the most valuable customers and how seasonality or product changes affect long-term loyalty.
By calculating CLV for each cohort separately, you can directly compare the long-term impact of different acquisition strategies or website changes. It makes your decision making much sharper and truly data-driven.
Forecasting the Future with Predictive CLV
This is where things get really clever. Predictive CLV is the most advanced method. Unlike historic models, which look in the rear-view mirror, this approach uses forecasting techniques and machine learning to predict a customer's future spending.
Predictive models gobble up a wide range of data points to make their forecasts, including:
- Past transaction history
- Website browsing behaviour and engagement
- Demographic information
- Customer service interactions
This type of customer lifetime value calculation is a lot more complex and hungry for data. But the payoff is huge. It gives you the most accurate, forward-looking estimate of a customer's worth, even for brand-new customers who have barely bought anything.
One of its biggest strengths is identifying high-potential customers early. A model could flag a new customer who has only made one small purchase but whose browsing patterns are spookily similar to your most loyal VIPs. This is a green light to nurture that relationship with targeted offers before your competitors even know they exist.
Whilst you might need specialist skills or software to build a predictive model, the strategic edge it delivers is immense, allowing you to allocate your marketing budget with surgical precision.
Which Model Is Right for You?
Choosing between these methods isn’t about finding the "best" one; it's about picking the most appropriate one for your current situation and resources. To make it clearer, here’s a quick comparison.
Comparison of CLV Calculation Methods
| Method | Complexity | Data Required | Best For |
|---|---|---|---|
| Historic CLV | Low | Basic sales data (APV, APFR, Lifespan) | Businesses just starting with CLV or with limited data history. |
| Cohort Analysis | Medium | Transactional data with customer acquisition dates. | Analysing marketing campaign effectiveness and customer behaviour trends. |
| Predictive CLV | High | Large, detailed datasets (transactions, behaviour, demographics). | Mature businesses aiming to forecast future value and personalise marketing at scale. |
The best path is often a gradual one. Start with the historic model to get a solid baseline. As your data and confidence grow, you can level up to cohort analysis and eventually explore predictive modelling to really fine-tune your growth strategy.
How to Build a CLV Calculator in Excel or Google Sheets
You don't need to sign up for another expensive software subscription to start calculating customer lifetime value. Honestly, the tools you're probably already using every day—like Microsoft Excel or Google Sheets—are more than capable of building a CLV calculator that's both powerful and insightful.
This hands-on approach cuts through the jargon and puts CLV analysis directly in your hands, without adding another line item to your budget. Let's walk through setting up your own spreadsheet, from organising your raw data to crafting the formulas that will give you the numbers you need.
Setting Up a Simple Historic CLV Calculator
The quickest and most direct way to get started is by building a calculator for historic CLV. This model looks at past customer data to give you a solid baseline understanding of what your customers are worth. It’s the perfect first step.
First things first, you need to structure your spreadsheet. I always recommend creating a clean, dedicated 'Inputs' section with clearly labelled cells for your core components:
- Total Revenue: The total sales income over a set period (e.g., the last 12 months ).
- Total Purchases: The total number of individual transactions within that same timeframe.
- Total Unique Customers: The number of different customers who made those purchases.
- Average Customer Lifespan (in years): Your best estimate of how long a typical customer stays with you.
Once those inputs are clearly defined, you can set up a separate 'Calculations' area where the spreadsheet will do all the heavy lifting.
Crafting the Core Formulas
Now it's time to translate the CLV formula into spreadsheet functions. This really just means calculating your averages first. In your 'Calculations' section, you’ll need to set up three key formulas:
- Average Purchase Value (APV):
In a new cell, divide your Total Revenue
by your Total Purchases
. So if your revenue is in cell
B2and your purchases are inB3, the formula is simply=B2/B3. - Average Purchase Frequency (APF):
Next, you'll figure out how often a customer buys from you. Divide the Total Purchases
by the number of Total Unique Customers
. Using the same example cells, this would be
=B3/B4. - Customer Value (CV):
This gives you the average annual value of a customer. All you do is multiply the APV
by the APF
. Your formula will look something like
=B6*B7, assuming those are the cells where you calculated APV and APF.
Finally, you can pull it all together for the main CLV calculation. In a prominent cell labelled 'CLV'
, multiply your calculated Customer Value
by your Average Customer Lifespan
. The formula would be something like =B8*B5
.
Pro Tip: Get into the habit of using cell locking (the
$symbol in formulas, like$B$2). This is a lifesaver if you plan to expand your sheet later. It makes sure your formulas always point to the right input cells, even when you copy them elsewhere for more complex analysis.
Going Deeper with a Cohort-Based Model
A basic CLV is great, but a cohort analysis model gives you a much sharper, more granular view. This approach involves grouping customers based on when they made their first purchase—for instance, all customers who joined in January 2023—and then tracking their spending habits over time.
To build this, you’ll need a raw data tab with three essential columns:
- Customer ID
- Transaction Date
- Transaction Value
From there, you can use Pivot Tables to automatically group customers into cohorts and see their cumulative spending month by month. Whilst it's a bit more involved, this method uncovers crucial trends, showing you which acquisition periods delivered your most valuable long-term customers.
Manually updating all this data can become a real time-sink. This is exactly where looking into business automation can free up valuable hours for actual analysis instead of just mind-numbing data entry.
Keeping Your Data Clean for Reliable Results
The most sophisticated formula in the world is useless if you're feeding it bad data. The old saying 'garbage in, garbage out' is especially true for any CLV calculation.
Maintaining good data hygiene is completely non-negotiable for accuracy. To make sure your calculator gives you insights you can trust, stick to these simple rules:
- Be Consistent:
Always use the same date format (
DD/MM/YYYY) and currency format across your entire dataset. No exceptions. - Remove Duplicates: Regularly scan for and delete any duplicate transaction entries that could be artificially inflating your revenue or purchase counts.
- Handle Returns Properly: Make sure refunds and returns are recorded correctly (usually as negative values) to give you a true picture of net revenue.
By building your own calculator and keeping your data pristine, you create a powerful, cost-effective tool that provides a clear and accurate view of your customers' long-term value.
Using CLV to Sharpen Your Marketing Strategy
Working out your Customer Lifetime Value is a brilliant first step, but the number itself is just the beginning. The real magic happens when you put that insight into action. Your CLV data should become the bedrock of a smarter, more efficient marketing machine, helping you move beyond guesswork and into confident, data-driven decisions.
This is where you translate a raw metric into tangible results. By using CLV, you can finally pinpoint who your best customers really are, figure out how to find more people just like them, and know exactly where to invest your marketing budget for the best possible return.

Segment Your Customers to Find Your VIPs
Let's be honest: not all customers are created equal. CLV proves it. One of its most powerful applications is segmenting your customer base not just by demographics, but by their long-term value. This process instantly shines a spotlight on your most profitable groups—your 'VIPs'.
Once you’ve identified these high-value segments, you can start tailoring your marketing efforts specifically to them.
- Personalised Campaigns: Think exclusive offers, early access to new products, or loyalty programmes actually designed to reward and keep your best customers.
- Lookalike Audiences: Take the characteristics of your high-CLV group and build lookalike audiences on platforms like Meta or Google. It’s a shortcut to targeting new prospects who share the same traits as your most profitable customers.
- Refined Messaging: Analyse what makes your VIPs tick. What do they buy? Which marketing messages did they respond to? Use these insights to sharpen your ad copy and content to attract more of the right people.
By focusing your attention on the customers who contribute most to your bottom line, you ensure your marketing budget is spent nurturing your most valuable relationships.
Master the CLV to CAC Ratio
The relationship between Customer Lifetime Value (CLV) and Customer Acquisition Cost (CAC) is arguably the single most important metric for judging the long-term health of your marketing. It tells you, in no uncertain terms, if your business model is sustainable.
CAC is simply the total cost of sales and marketing needed to acquire a new customer. The formula is straightforward:
CAC = Total Marketing & Sales Spend ÷ Number of New Customers Acquired
The real insight comes when you compare this to your CLV. The CLV:CAC ratio shows you how much value you're getting for every pound you spend on acquisition.
A healthy CLV:CAC ratio is generally considered to be 3:1 . This means for every £1 you spend acquiring a customer, you can expect to get £3 back in lifetime value. A ratio below 1:1 is a red flag – you're losing money on every customer you bring in.
This ratio gives you a clear verdict on profitability. If it’s too low, you're likely overspending to get customers through the door. If it's incredibly high (say, 5:1 or more), you might actually be underinvesting in marketing and leaving growth on the table.
Optimise Your Marketing Channels
Where are your best customers actually coming from? Your CLV data holds the answer.
By calculating the CLV of customers acquired from different channels—organic search, paid social, email marketing—you can see which platforms deliver the most profitable long-term relationships, not just the cheapest clicks.
Imagine you find that customers from organic search have a CLV of £500 , whilst customers from a specific paid social campaign only have a CLV of £250 . Even if the acquisition cost is similar, you now know that investing more in SEO is likely to yield a far greater long-term return.
This channel-specific analysis lets you:
- Reallocate Your Budget: Shift spend away from low-CLV channels and double down on the ones that attract high-value customers.
- Tailor Channel Strategy: Customise your messaging and offers for each channel based on the type of customer it brings in.
- Improve ROI: Make informed, data-backed decisions that directly boost the return on your marketing investment.
In the UK, the focus on customer experience is directly linked to higher retention and, in turn, a healthier CLV. Research from KPMG shows that UK businesses with strong customer experience leadership achieve 89% customer retention rates and see that customers who shop across multiple channels have a 30% greater lifetime value . These figures prove that investing in retention is a proven path to profitability.
Ultimately, a strong focus on CLV is about building a sustainable business. To get there, it’s essential to implement robust and effective new customer retention marketing tactics that foster genuine loyalty. This strategic shift transforms marketing from a cost centre into a predictable engine for long-term growth.
The Future of CLV Calculation with AI
Whilst historical data and cohort analysis give you a solid footing, the next real leap in calculating customer lifetime value is all about artificial intelligence. AI is shifting the entire game from looking backwards at what customers did , to accurately predicting what they’re going to do next.
This isn't just a minor upgrade; it's a fundamental change in how we approach CLV. Traditional methods are great, but they often lean on broad averages and past trends. AI-driven models, on the other hand, can process enormous, messy datasets in real-time to find subtle patterns in individual customer behaviour.
Moving Beyond Historical Averages
AI has a knack for spotting micro trends that would be totally invisible in a simple spreadsheet. It can connect the dots between seemingly random actions—a customer’s browsing history, a recent support ticket, their purchase frequency—to build a CLV forecast that's alive and constantly updating.
This lets you be far more proactive. Instead of just reacting when a customer stops buying, an AI model can flag them as a churn risk weeks or even months ahead, all based on a small dip in their engagement. By the same token, it can pinpoint the perfect moment to send an upsell offer based on their recent activity.
The Business Advantages of AI-Powered CLV
When you weave AI into your customer lifetime value calculation , you start unlocking some serious commercial advantages. These models give you the intelligence to make sharper, more profitable decisions right across the business.
Here’s where it gets powerful:
- Hyper-Personalisation: AI allows you to move past clunky segmentation and into true one-to-one marketing. You can tailor offers and messages based on an individual’s predicted value and their specific needs.
- Real-Time Churn Prediction: By spotting at-risk customers early, you can roll out highly targeted retention campaigns with surgical precision, saving valuable relationships before they’re gone for good.
- Optimised Resource Allocation: You can confidently invest more in acquiring and looking after customers predicted to have a high future value. This makes sure your marketing and service budgets are actually working for you, not against you.
The real power of AI in CLV isn't just about a more accurate number. It’s about getting an early warning system and a strategic guide all in one. It tells you exactly where to focus your efforts for the biggest long-term payoff.
This forward-looking approach is already paying dividends for UK businesses. According to the UK State of Commerce Report, companies using AI in their CLV strategies are seeing a 25% increase in business growth. That's because AI allows for real-time tweaks, helping businesses build tiered service models and spot repurchasing opportunities with incredible accuracy. You can dig into more findings from the Signifyd report here.
Ultimately, AI transforms CLV from a metric you report on once a quarter into an active, operational tool that guides your marketing every single day. If you want to get a broader sense of its impact, our article on how artificial intelligence is revolutionising digital marketing gives more context on this important shift. Getting to grips with these advanced methods is how you prepare your business for the next generation of customer value management.
Common Questions About CLV Calculation
Even with the formulas in hand, a few questions always pop up when it's time to actually start calculating customer lifetime value. It’s one thing to get the theory, but it's another to apply it confidently to your own business data.
Let's clear up some of the most common queries we hear, tackling the real-world challenges around data, timing, and how to interpret the numbers you end up with. These answers should help you move from calculation to confident action.
How Often Should I Calculate CLV?
There’s no single right answer here, but finding a good rhythm is key. For most businesses, a quarterly or semi-annual check-in is the perfect starting point.
This cadence is frequent enough to spot real trends and see if your marketing efforts are moving the needle, but not so often that you get bogged down in analysis. Of course, if you’re in a fast-moving industry or running an intense retention campaign, you might want to switch to a monthly calculation for more immediate feedback.
What Is a Good CLV to CAC Ratio?
This is one of the big ones, because it gets right to the heart of your business's sustainability. Whilst it varies, the gold standard for a healthy CLV to Customer Acquisition Cost (CAC) ratio is 3:1 .
This means for every £1 you spend to bring a new customer in, you should expect to generate £3 in net profit from them over time. A ratio that dips much lower suggests you’re overspending on acquisition. A much higher one could mean you’re underinvesting in marketing and leaving growth on the table.
Think of it as a solid guideline, not a strict rule. The goal is to make sure your acquisition spend is a profitable investment, and a 3:1 ratio is a strong signal you're on the right track.
What if I Don't Have Enough Data?
This is a really common hurdle, especially for newer businesses or those that just haven't been tracking customer data in detail. If you find you don't have years of rich data for a predictive model, don't sweat it.
The best thing to do is start with the historic CLV formula . It’s accessible, straightforward, and still delivers incredibly valuable insights using the basic sales data you almost certainly have. It gives you a solid baseline to work from.
As your business grows and you collect more transactional and behavioural data, you can graduate to more sophisticated methods like cohort analysis and, eventually, predictive modelling. The most important thing is just to start somewhere and build from there.
At Superhub , we specialise in turning complex data like CLV into actionable growth strategies. If you're ready to move beyond spreadsheets and truly operationalise your marketing for long-term profitability, find out how our expert team can help. Learn more at Superhub.
Want This Done For You?
SuperHub helps UK brands with video, content, SEO and marketing that actually drives revenue. No vanity metrics. No bullsh*t.